


Checking local crime data can help you understand which incidents have recently been recorded near a home, workplace or rental property. But the figures cannot tell you exactly how safe one address is. Police.uk uses anonymised locations, broad crime categories and incidents recorded by the police.
For a more reliable picture, compare several months of data, check what the figures cover and visit the area yourself. This article explains how to search crime data by postcode, compare two locations fairly and respond to concerns such as burglary, vehicle crime and poorly lit entrances.

Key Takeaways
-
A crime rate by postcode gives an area-level picture, not a precise safety score for an individual property. Map locations are approximate, and the figures only cover incidents recorded by the police.
-
Review six to twelve months of data where possible. A single month may reflect an isolated event rather than an ongoing local pattern.
-
When comparing postcodes, use the same dates, crime categories and map area. Comparing different time periods or boundaries can produce misleading results.
-
Focus on crime types relevant to how you will use the area. Vehicle crime near your regular parking place may matter more than shoplifting concentrated around a distant retail centre.
-
Before renting or buying, visit the neighbourhood and check whether recorded hotspots relate to your actual parking space, walking routes and property entrances.
-
Match any security improvements to the concern identified: secure and monitor side access for burglary risks, retain relevant footage of incidents involving vehicles, and improve lighting at dark approaches.
How to Check Crime in Your Postcode
Police.uk is the main place to check street-level police-recorded incidents in England, Wales and Northern Ireland. A UK crime rate by postcode search should still be treated as an area-level check because exact incident addresses are not published.
Find Your Area on Police.uk
Enter the full postcode, street address or area, then select the correct neighbourhood and open its crime map. You can view incidents recorded near that location and explore information about the wider local policing area.
Make sure you have the right neighbourhood, especially if the postcode is close to a ward or police-force boundary. Nearby properties may appear under different local area pages even though residents use the same roads, stations and shops.
Choose the Dates and Crime Categories
Use the date selector to choose the month you want to review. Start with “All crime” for an overview, then filter the map by categories relevant to your concerns, such as burglary, vehicle crime, robbery or criminal damage and arson.
Repeat the search across several consecutive months. This helps you distinguish an ongoing local pattern from an isolated increase in one month.
Check the Area Covered by the Results
Zoom in on the map and check which streets, parking areas and public spaces are included around the postcode. Focus on locations connected to the property, such as the nearest station, the route to local shops, surrounding car parks and streets used for overnight parking.
Use comparable boundaries or search radii when comparing another postcode; matching the zoom level alone does not guarantee equivalent coverage. Police.uk markers show approximate locations rather than exact addresses, so use them to identify clusters and recurring problem areas—not to associate an incident with a specific property.

What Do the Crime Figures Mean?
Depending on the website and view selected, the results may show crime counts, population-based rates, local hotspots or investigation outcomes. Understanding the difference will help you read the figures correctly.
|
Data Shown |
What It Means |
What to Check |
|
Crime count |
Recorded offences within the selected area and period |
Dates, boundaries and whether ASB is separate |
|
Category count |
Records grouped as burglary, vehicle crime or another type |
The category definition |
|
Map marker |
An approximate, anonymised location |
Do not treat it as an exact address |
|
Rate per 1,000 |
Recorded crimes adjusted for the resident population |
Population year and area type |
|
Crime outcome |
The latest recorded result or case status |
When the outcome was updated |
Crime Counts vs. Rates per 1,000 People
A count shows how many offences were recorded. A rate adjusts that total for the number of residents:
Crime rate per 1,000 people = (Number of recorded crimes ÷ Resident population) × 1,000
Rates are generally more useful when comparing areas of different sizes. However, they still need context. A town centre may have relatively few residents but receive thousands of commuters, shoppers and visitors each day, making a resident-based rate appear especially high.
Police.uk’s comparison charts use twelve-month totals per 1,000 residents for wider local areas, rather than individual postcodes. Other websites may apply different population estimates or geographic boundaries, so confirm the methodology before comparing their results.
Burglary, Vehicle Crime and Other Categories
The overall crime total only gives a general picture, so check the individual categories that are most relevant to the property. Burglary data can help you assess concerns around doors, windows and side access, while vehicle crime is more useful if you plan to park on a driveway or nearby street. Anti-social behaviour is shown as a distinct category on Police.uk and may include issues such as nuisance or disorder, so review it as an additional local indicator rather than automatically adding it to the total crime figure.
Monthly Changes vs. Longer-Term Trends
A rise in one month may result from a group of connected incidents, seasonal activity, changes in reporting or normal variation. One busy month does not necessarily mean the area is becoming less safe.
Review six to twelve months where possible. Look at whether the same crime type appears repeatedly, whether incidents cluster around certain facilities and whether similar changes occurred during the same period in previous years.
How to Compare Two Postcodes
A useful comparison requires consistent dates, categories and boundaries. Comparing a one-month street-level count with an annual local-authority rate will not produce a reliable result.
The Same Dates, Boundaries and Crime Types
When comparing crime rates by postcode, use:
-
The same start and end dates
-
The same crime categories
-
Equivalent geographic areas
-
The same measurement—count or population rate
-
The same treatment of anti-social behaviour
-
Sources updated at roughly the same time
If the boundaries differ, use the figures as general context rather than declaring one postcode safer based on the totals alone.
Town Centres vs. Residential Streets
Check whether the two postcodes cover similar types of area. A town-centre postcode may show more shoplifting, public-order incidents and vehicle crime because more people visit the area, while a residential postcode may have fewer incidents but a much smaller population. Similar differences can be seen across the most dangerous places in London, where the type and location of an area affect how crime figures should be interpreted. Instead of comparing total crime alone, compare the same crime categories and check where those incidents are concentrated.
Local Visits Before Renting or Buying
After comparing the figures, visit both neighbourhoods during the day and after dark to see how relevant the recorded incidents are to the properties. If vehicle crime is concentrated near a station car park, for example, check whether you would park there regularly.If burglary appears near residential streets, look at the property’s doors, side access and surrounding visibility, including areas that may need coverage from outdoor security cameras. This connects the crime data with the places and routes you would actually use.
What Can You Do About Local Crime Concerns?
Start with the basics: secure locks, security cameras, closed gates, lighting and safer parking habits.
Burglary Concerns Around Side Entrances
If the postcode data shows repeated burglary around nearby residential streets, inspect the parts of the property that are less visible from the road. Side gates, rear doors and accessible windows should close securely, while ladders and tools should be stored where they cannot be used to gain entry.
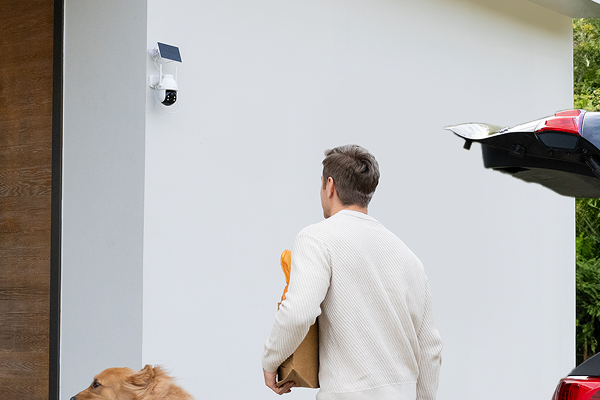
A narrow side passage can still be difficult to monitor because anyone entering it quickly moves out of sight of the front door. The ieGeek ZS-GX4S 5MP solar security camera lets you pan and tilt the view from your phone to check the gate and route towards the back of the house. Its 5MP video can capture useful detail around the entrance, while motion alerts let residents check recorded activity within the camera’s view.

Vehicle Crime Near Your Parking Area
When vehicle crime appears frequently around the postcode, check whether the incidents are concentrated near on-street parking, public car parks or residential driveways. Locking the vehicle, removing visible belongings and keeping keys away from doors and windows remain the first precautions, but they do not provide a record of what happened if damage or theft is discovered later.
The ieGeek S7 wireless 24/7 recording camera is suited to a driveway where a longer activity record is more useful than a single alert clip. Its AOV 24/7 recording can help you review activity before and after an incident, although the detail captured depends on the recording settings and camera coverage. This fuller timeline can help you explain what happened when reporting an incident to the police or an insurer.
Dark Approaches to Your Home
Local crime figures cannot show whether poor lighting makes a particular property easier to approach unnoticed. After checking the postcode data, walk around the driveway, garage entrance and side path after dark to find areas where a person, vehicle or movement would be difficult to see and where floodlight security cameras could improve visibility.
For a wide, poorly lit approach, the hard-wired ieGeek ZY-E2 floodlight camera combines a 2,600-lumen floodlight with a 5MP camera. When activity is detected, the bright light improves visibility across the entrance, while the light-and-siren response may help deter an intruder. The extra light can also make clothing and vehicle colours easier to see when you review footage of activity near the entrance.

FAQ
Is anti-social behaviour counted as a crime?
Not always. Anti-social behaviour can include nuisance or disorder that is not recorded as a criminal offence. Police.uk therefore shows it as a separate category of incidents; an ASB record should not automatically be treated as a recorded crime.
What does “investigation complete; no suspect identified” mean?
It means the police have taken the investigation as far as reasonably possible but have not identified a suspect. The case is closed at that stage, although it may be reviewed if new evidence or investigative opportunities emerge.
Why do crime-checking websites show different figures?
Websites may use different date ranges, boundaries, crime categories, population estimates and update schedules. They may also handle anti-social behaviour or unmapped incidents differently. Check the methodology before comparing their headline figures.
Can you check crime data for Scottish postcodes?
Police.uk does not provide street-level crime data for Scottish postcodes. Instead, check Police Scotland or Scottish Government crime statistics, which include ward-level data and local-authority figures respectively, rather than an equivalent postcode crime map.
How can you report an incident missing from the map?
The crime map is not a reporting service. Call 999 if a crime is in progress or someone is in immediate danger. For non-emergencies, report the incident online through the relevant police force or call 101.
Do not wait for the incident to appear on the map. If an ieGeek ZS-GX4S or another home camera recorded activity near the entrance, check the relevant time, retain the original footage and include these details when making the report.
Conclusion
Postcode crime data is a starting point, not a final judgement about an area. Check the period, categories and boundaries, then compare several months rather than relying on one number.
If you are renting or buying, combine the data with visits at different times and an inspection of the property. If the figures reveal a specific concern, respond directly—whether that means improving a gate, changing parking habits, adding lighting or covering a genuine blind spot.
About the Author
 |
Written by the ieGeek team, a brand dedicated to making smart security simple and accessible for everyone. With experience in designing easy-to-install security cameras, we aim to provide practical advice based on real user scenarios. Our goal is to provide reliable, easy-to-use technology that helps users stay connected and protected in different environments. |